ED Data Wrangling Exercises#
Emergency departments around the world must deal with highly attendance numbers on a daily basis. The following exercises work with multiple ED datasets. You will wrangle the dataset into a useful format using pandas and then visualise the time series using matplotlib.
The data sets used in these exercises are synthetic, but have been generated to reflect real emergency department demand in the United Kingdom.
Imports#
import pandas as pd
import numpy as np
import matplotlib.pyplot as plt
Datasets#
The dataset syn_ts_ed_long.csv contains data from 4 emergency departments in 2014. The data are stored in long (sometimes called tidy) format. You are provided with three columns: date (non unique date time formatted), hosp (int 1-4) and attends (int, daily number of attends at hosp \(i\))
The dataset syn_ts_wide.csv contains the same data in wide format. Each row now represents a unique date and each hospital ED has its own column.
Exercise 1#
Task 1:
Read the two datasets into a pandas dataframe and inspect the columns and data so that you understand the dataset description above.
Hints:
The URL’s for the datasets are provided below.
# your code here ...

LONG_URL = 'https://raw.githubusercontent.com/health-data-science-OR/' \
            + 'hpdm139-datasets/main/syn_ts_ed_long.csv'
WIDE_URL = 'https://raw.githubusercontent.com/health-data-science-OR/' \
            + 'hpdm139-datasets/main/syn_ts_ed_wide.csv'
# example solution
long_df = pd.read_csv(LONG_URL)
long_df.head()
| date | hosp | attends | |
|---|---|---|---|
| 0 | 2014-04-01 | 1 | 331 |
| 1 | 2014-04-02 | 1 | 340 |
| 2 | 2014-04-03 | 1 | 316 |
| 3 | 2014-04-04 | 1 | 304 |
| 4 | 2014-04-05 | 1 | 292 |
wide_df = pd.read_csv(WIDE_URL)
wide_df.head()
| date | hosp_1 | hosp_2 | hosp_3 | hosp_4 | |
|---|---|---|---|---|---|
| 0 | 2014-04-01 | 331 | 287 | 195 | 184 |
| 1 | 2014-04-02 | 340 | 293 | 177 | 181 |
| 2 | 2014-04-03 | 316 | 249 | 183 | 192 |
| 3 | 2014-04-04 | 304 | 313 | 208 | 157 |
| 4 | 2014-04-05 | 292 | 291 | 218 | 166 |
Exercise 2:#
Assume you have only been provided with syn_ts_ed_long.csv.
Task:
Convert the data into wide format.
the output of your code should a
pd.Dataframeequivalent tosyn_ts_ed_wide.csvMake a decision about the appropraite data types for each of the series. For example, by default the attendance column is an
int64. Is this sensible? What other type of integer could the hospital columns be stored as?
Advanced Task:
Your data wrangling code should make use of chained commands in
pandas.
Hints
There are various ways to complete this task. You may want to make use of
pivot_table.One complication with a pivot is that you end up with a
MultiIndexcolumn for the hospital and number of attends. This is not always particularly clear for labelling. An option is to remove the Mulit-index during wrangling. You could explore the of transposing thepd.Dataframeusing.Tand the.reset_index()to drop the index.You may want to build up your code command by command to help debug as you go along.
Don’t forget about data types.
# your code here ...
# example solution

def ed_data_to_wide(file_path):
    '''
    Return the ED data in wide format.

    1. Pivot table
    2. Transpose and drop the ('attends', hosp_i) multi-index
    3. Rename columns [0, 1, 2, 4] tp ['hosp_1', 'hosp_2', 'hosp_3', 'hosp_4']
    4. Index to DateTimeIndex
    5. Drop the additional uneeded series 'date' (as stored in index as well)
    6. Convert attendence numbers from int64 to int16

    Params:
    ------
    file_path: str
        Path to wide format file

    Returns:
    -------
    pandas.DataFrame
    '''
    # column name transfers
    translated_names = {0:'hosp_1',
                        1:'hosp_2',
                        2:'hosp_3',
                        3:'hosp_4'}

    data_types = {'hosp_1':np.int16,
                  'hosp_2':np.int16,
                  'hosp_3':np.int16,
                  'hosp_4':np.int16}

    df = (pd.read_csv(file_path)
            .pivot_table(values=['attends'], index=['date'], columns=['hosp'])
            .T.reset_index(drop=True)
            .T.rename(columns=translated_names)
            .assign(date=lambda x: pd.to_datetime(x.index))
            .set_index('date')
            .astype(data_types)
         )

    return df
wide_df = ed_data_to_wide(LONG_URL)
wide_df.info()
<class 'pandas.core.frame.DataFrame'>
DatetimeIndex: 275 entries, 2014-04-01 to 2014-12-31
Data columns (total 4 columns):
 #   Column  Non-Null Count  Dtype
---  ------  --------------  -----
 0   hosp_1  275 non-null    int16
 1   hosp_2  275 non-null    int16
 2   hosp_3  275 non-null    int16
 3   hosp_4  275 non-null    int16
dtypes: int16(4)
memory usage: 4.3 KB
Exercise 3:#
Now assume that you have been provided with the data in syn_ts_ed_wide.csv
Task:
Convert the dataset from wide format to long (tidy) format.
Advanced task
Your data wrangling code should make use of chained commands in
pandas.
Hints:
Investigate the
pandasfunctionwide_to_long()or the functionmelt()
# your code here...
def ed_data_to_long(file_path):
    '''
    Return the ED data in long format. Uses pd.wide_to_long()
    Assume wide format file is used.

    1. pd.wide_to_long()
    2. reset_index() to remove multi-index
    3. rename col 'hosp_'  to 'attends'
    4. date to datetime
    5. Convert attendence numbers from int64 to int16 amd hosp_id to int8.
    (could also be a categorical field.)

    Params:
    ------
    file_path: str
        Path to wide format file

    Returns:
    -------
    pandas.DataFrame
    '''

    translated_names = {'hosp_':'attends'}
    data_types = {'hosp': np.int8, 'attends':np.int16}

    long_df = (
                pd.wide_to_long(pd.read_csv(file_path), stubnames='hosp_',
                                i=['date'], j='hosp')
                .reset_index()
                .rename(columns=translated_names)
                .assign(date=lambda x: pd.to_datetime(x['date']))
                .astype(data_types)
                )

    return long_df
long_df = ed_data_to_long(WIDE_URL)
long_df.info()
<class 'pandas.core.frame.DataFrame'>
RangeIndex: 1100 entries, 0 to 1099
Data columns (total 3 columns):
 #   Column   Non-Null Count  Dtype
---  ------   --------------  -----
 0   date     1100 non-null   datetime64[ns]
 1   hosp     1100 non-null   int8
 2   attends  1100 non-null   int16
dtypes: datetime64[ns](1), int16(1), int8(1)
memory usage: 11.9 KB
Exercise 4#
We will now move onto visualising the dataset using matplotlib
Task:
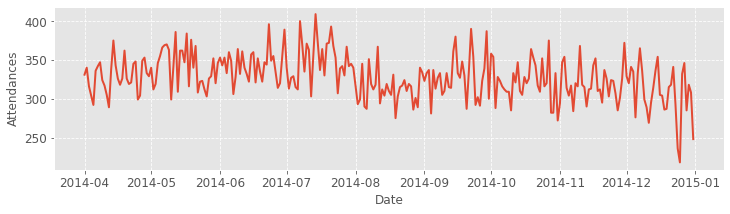
Using the wide format data, create a line plot of the data for the ED located at hospital 1.
Label the y axis ‘Attendances’
Label x axis ‘Date’
Use a fontsize of 12
Provide a background grid for the plot.
Save the plot as a .png file with dpi of 300.
Hints
Feel free to adapt the plot to improve its appearance using whatever
matplotliboptions you prefer.
# your code here ...
# example solution

fig = plt.figure(figsize=(12,3))
ax = fig.add_subplot()
ax.set_xlabel("Date", fontsize=12)
ax.set_ylabel("Attendances", fontsize=12)

_ = ax.plot(wide_df['hosp_1'], lw=2)
# include x, y grid
_ = ax.grid(ls='--')

# set size of x, y ticks
_ = ax.tick_params(axis='both', labelsize=12)

# save the figure
fig.savefig('hosp_1_ed.png', dpi=300)
Exercise 5#
Task:
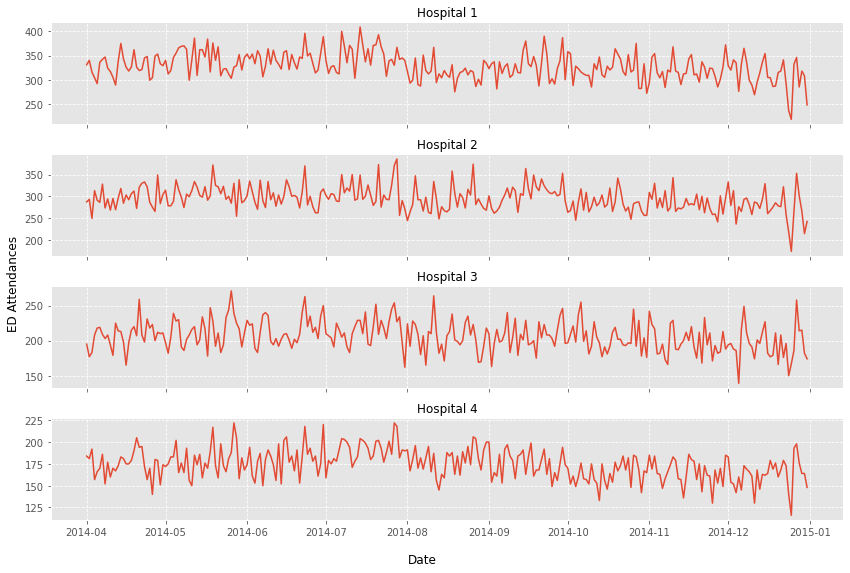
Create a grid of subplots with 1 column and 4 rows. Each subplot should display one of the hospital ED’s.
Label each subplot with the appropraite hospital.
Provide an overall figure y axis label of ‘ED Attendances’
Give the figure and appropriate sizing
Hints:
There are several ways to create a grid of subplots. The easiest for this problem is to use the factory function
plt.subplots(). Refer back to thematplotlibsections in the book for help.If you are using
matplotlibversion 3.4 or above you can usefig.supylabel()andfigsupxlabel()to set an overall axis label.
# your solution here ...
# example solution

# print(plt.style.available)  # list all default styles available
# plt.style.use('ggplot')

# try swapping tight_layout for constrained_layout=True and also omitting it.
fig, axs = plt.subplots(nrows=4, ncols=1, tight_layout=True, figsize=(12,8),
                        sharex=True)

# note that axs is a 2D array
FS_SUBTITLE = 12
for hosp_idx in range(0, 4):
    _ = axs[hosp_idx].plot(wide_df[f'hosp_{hosp_idx+1}'])
    _ = axs[hosp_idx].set_title(f'Hospital {hosp_idx+1}', fontsize=FS_SUBTITLE)
    _ = axs[hosp_idx].grid(ls='--')

# axis labels matplotlib >=3.4
AXIS_LABEL_SIZE = 12
_ = fig.supylabel('ED Attendances', fontsize=AXIS_LABEL_SIZE)
_ = fig.supxlabel('Date', fontsize=AXIS_LABEL_SIZE)